Why Improving Ecommerce Conversion Rates Requires More Than Data
To improve ecommerce conversion rates, you must understand not only what your visitors do but why they do it—combining analytics with buyer psychology. Metrics alone show you drop-offs and sales, but actionable gains come from uncovering the motivations, hesitations, and emotional triggers that drive real customer decisions.
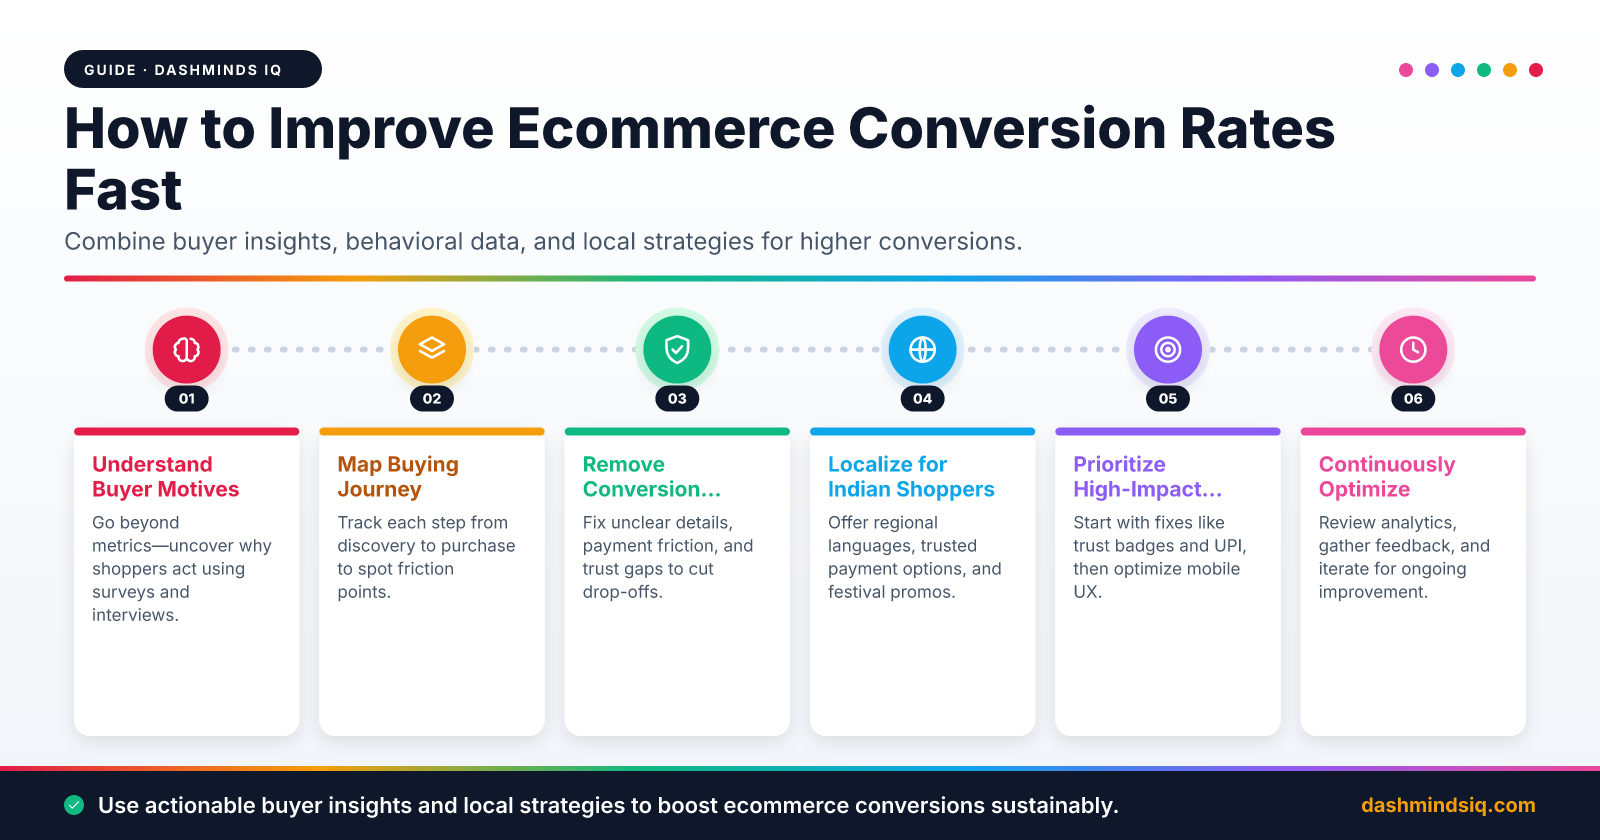
Most ecommerce stores in India track sales, bounce rates, and cart abandonment, but these numbers rarely explain the reasons behind stalled purchases. For example, a spike in abandoned carts could result from unclear pricing, lack of trust, or a confusing checkout—not just product disinterest.
At DashMinds IQ, we integrate behavioral research—like customer surveys, session replays, and interviews—directly into our retail & ecommerce technology solutions. This approach uncovers the “why” behind buyer actions, allowing us to recommend changes that target the root causes of conversion loss, not just the symptoms.
Why Sales Data Alone Isn't Enough
Sales data answers "what happened" but not "why it happened." Two customers might buy the same product for entirely different reasons—one for price, the other for convenience. Similarly, those who abandon their carts may do so due to lack of trust, confusing checkout, or hidden fees.
Behavioral insights bridge this gap. By combining quantitative metrics with qualitative feedback, you reveal the hidden blockers and motivators in your funnel. This enables more targeted, effective optimizations.
How DashMinds IQ Integrates Behavioral Insights
We blend analytics with behavioral research, using:
- Session replays to watch users navigate your store.
- Exit surveys to capture hesitations in real time.
- User interviews for deep insights into buyer needs.
This methodology has helped our clients move beyond surface-level tweaks to achieve sustained improvements in conversion rates.
Mapping the Modern Digital Buying Journey
The Indian ecommerce journey is rarely linear. Shoppers move fluidly between discovery, research, evaluation, and purchase—often across devices and platforms.
How Indian Ecommerce Shoppers Navigate
A typical Indian buyer’s journey might look like this:
- Discovery: Spots a product on Instagram or a WhatsApp forward.
- Research: Compares prices on aggregator apps or competitor sites, reads reviews, checks YouTube unboxings.
- Evaluation: Adds items to cart, looks for coupons, checks delivery timelines, and consults family or friends.
- Decision: Decides based on trust, payment options, and perceived value.
- Purchase: Completes transaction—often via mobile, using UPI or cash on delivery.

Where Friction Typically Occurs
- Mobile UX: Slow load times or clunky navigation frustrate mobile-first shoppers.
- Checkout: Lack of local payment options, unclear costs, or forced account creation cause drop-offs.
- Trust Signals: Missing reviews, vague return policies, and unclear support channels reduce confidence.
- Social Proof: Weak or absent user testimonials lead to hesitation.
Worked Example: From Discovery to Purchase
Consider a shopper who discovers a kurta on Instagram. She clicks through to your site, adds it to her cart, but leaves after seeing unexpected delivery charges at checkout. Later, a WhatsApp reminder from a friend brings her back—she completes the purchase after seeing clear return policies and UPI payment.
Mapping these steps shows exactly where friction can be reduced and trust can be built.
What Actually Influences Customer Purchase Decisions?
Conversion is shaped by a complex web of motivators and influences. In India, these factors are especially nuanced, blending urgency, value perception, trust, and social context.
Primary Motivators
- Needs and Urgency: Buyers with a pressing need convert faster. Flash sales and limited-time offers create urgency.
- Perceived Value: Shoppers weigh benefits versus cost. Bundling, discounts, or free shipping can tip the scales.
- Trust Factors: Visible return policies, secure payment gateways, and responsive support build confidence.
Secondary Influences
- Peer Reviews: Indian buyers trust regional reviews and ratings, especially in their language.
- Social Proof: WhatsApp shares, influencer endorsements, and local testimonials carry weight.
- Competitive Comparisons: Easy access to alternatives means your offer must stand out.
Localization: Unique Indian Factors
- Regional Language Content: Product info in local languages improves accessibility.
- Preferred Payment Options: UPI, wallets, and cash-on-delivery are essential.
- Cultural Timing: Promotions around festivals or local events drive higher conversions.
Comparison Table: Top Influencing Factors
| Factor | India: Impact | Global: Impact |
|---|---|---|
| Price Sensitivity | Very High | Moderate |
| Mobile Experience | Critical | High |
| Social Proof | High | High |
| Local Payments | Essential | Optional |
| Regional Language | High | Low |
| Delivery Trust | High | Moderate |
These differences make it crucial to localize your strategies for the Indian market.
Identifying—and Overcoming—Purchase Barriers in Your Store
Pinpointing why users drop off is the first step to improving ecommerce conversion rates. Common blockers range from unclear information to payment friction.
Typical Conversion Blockers
- Unclear Product Details: Missing specs, poor images, or vague descriptions.
- Pricing Doubts: Unexpected charges or lack of clarity on discounts.
- Complicated Checkout: Too many steps, forced logins, or missing guest checkout.
- Payment Friction: Limited local payment options or slow gateways.
- Trust Gaps: No reviews, hard-to-find return policy, or lack of support info.
Spotting Barriers with Tools
- Session Replays (e.g., Hotjar): Reveal where users hesitate or abandon.
- Surveys (e.g., Typeform): Ask abandoning users why they didn’t purchase.
- Abandonment Data (Google Analytics): Pinpoint high-exit pages or steps.
Example: Diagnosing and Fixing Cart Abandonment
A home décor retailer in India saw high cart abandonment at checkout. Session replays showed users stalling at the payment stage. Surveys revealed confusion over delivery charges. By displaying shipping costs upfront and enabling UPI payments, abandonment dropped significantly.
Quick Fixes vs. Strategic Improvements Checklist
- Quick Fixes:
- Add trust badges and clear return policy links.
- Enable guest checkout.
- Offer UPI and wallet payments.
- Display delivery charges early.
- Strategic Improvements:
- Redesign mobile navigation.
- Localize product content and customer support.
- Build a robust review/testimonial system.
- Personalize offers for different buyer segments.
Turning Buyer Insights into Conversion-Boosting Actions
Insights alone don’t move the needle—you need a decision framework to turn them into prioritized actions.
Prioritizing Changes: Impact vs. Effort
- High Impact, Low Effort: Add trust badges, clarify delivery info, enable local payments.
- High Impact, High Effort: Redesign mobile UX, segment communication, implement personalization.
- Low Impact, Low Effort: Adjust button colors, tweak microcopy.
- Low Impact, High Effort: Backend changes with minimal user-facing benefit.
Fast Wins for Indian Ecommerce
- Integrate UPI, Paytm, and wallet payments.
- Highlight “free returns” and WhatsApp support.
- Personalize offers by customer type—new vs. returning.
- Feature regional influencers in product visuals.
Tailoring Communication to Buyer Intent
Segment your audience—deal-seekers, loyalists, browsers—and adapt your messaging. Offer first-time buyers a time-limited discount while rewarding loyal customers with exclusive previews.
Case Study: 32% Conversion Uplift
A DashMinds IQ client, a mid-sized electronics retailer, used session replays and intent-based remarketing to identify key friction points. By prioritizing mobile trust signals and local payment options, and segmenting email offers, they achieved a 32% increase in conversion rates in just eight weeks.
Comparing Popular Strategies to Improve Ecommerce Conversion Rates
No single tactic fits all. Choosing the right mix requires understanding your audience and operational realities.
| Strategy | Pros | Cons | Best Fit |
|---|---|---|---|
| A/B Testing | Data-driven, measurable | Slow with low traffic | Mature stores |
| Live Chat | Addresses doubts in real time | Requires staff, can annoy some users | Complex/high-value sales |
| Mobile UX Redesign | Boosts mobile conversions | Resource intensive | Mobile-first audiences |
| Localized Content | Builds trust, improves reach | Translation/maintenance overhead | Regional/language markets |
| Reviews/Social Proof | Boosts trust and decisions | Hard to gather quickly | All except new launches |
| Personalization | Increases engagement/loyalty | Needs data/tools | Repeat buyers/subscribers |
How to Choose Your Strategy Mix
Start with high-impact, low-effort strategies. Expand to more resource-intensive tactics as your understanding of customer motivators deepens. Always align tactics with your primary buyer segments.
Pitfalls to Avoid
- Overlapping Experiments: Too many changes at once make it hard to measure results.
- Neglecting Mobile: With most Indian shoppers on mobile, this is non-negotiable.
- Ignoring Trust Factors: Discounts can’t compensate for lack of credibility or support.
Building a Continuous Conversion Optimization Process
Improving ecommerce conversion rates is an ongoing process, not a one-off fix. Customer preferences, technology, and competition evolve—your optimization must, too.
Why Continuous Optimization Matters
What works now may not work next quarter. Regularly reviewing analytics, feedback, and behaviors ensures your store stays ahead of customer expectations.
Setting Up Feedback Loops
- Analytics: Use Google Analytics, Mixpanel for ongoing tracking.
- User Feedback: Capture buyer and non-buyer input with micro-surveys.
- Session Analysis: Review session replays to spot emerging friction.
- Ongoing Iteration: Test, measure, and refine improvements one at a time.
DashMinds IQ Tools & Frameworks
We recommend:
- Behavioral Analytics: Hotjar, Smartlook, FullStory for qualitative insights.
- A/B Testing: Google Optimize, VWO for experiments.
- Personalization: WebEngage, MoEngage for dynamic content.
- Data Integration: Leverage our Data & Analytics Technology Services for advanced customer intelligence.
Your Next Steps
Start by identifying one or two friction points in your funnel. Implement a quick fix, measure its impact, and plan your next move. For a structured roadmap, partner with DashMinds IQ: our ecommerce and analytics teams can support you with tailored, actionable solutions.
Frequently asked questions
What influences ecommerce conversion rates the most?
Conversion rates depend on how effectively your store meets customer needs, builds trust, and reduces friction—especially around value perception, payment convenience, and product clarity. In India, local payment options, regional content, and strong social proof are particularly influential.
How can I identify why users are not converting on my online store?
Combine analytics to locate drop-off points with behavioral tools like session replays and exit surveys to understand the reasons. Patterns in abandonment, time spent on pages, and direct feedback will reveal the main conversion barriers.
Which strategies work best to improve ecommerce conversion rates in India?
Focus on optimizing mobile experience, enabling preferred local payments (UPI, wallets), building credible reviews and testimonials, and localizing content. Simple trust signals—clear returns, contact options—also make a major difference for Indian shoppers.
Can buyer behavior research really increase my sales?
Absolutely. Buyer behavior research uncovers the true reasons behind hesitations and drop-offs, allowing you to implement targeted changes that directly boost conversions and sales.
What is a good ecommerce conversion rate?
A typical ecommerce conversion rate in India ranges from 1% to 3%, but with systematic optimization and buyer insights, significantly higher rates are achievable—especially for niche or well-localized stores.
Ready to systematically improve ecommerce conversion rates with actionable, buyer-focused strategies? Contact DashMinds IQ to explore how our retail & ecommerce technology solutions and data & analytics expertise can help your online store achieve measurable growth.